LAB 3- Remarks
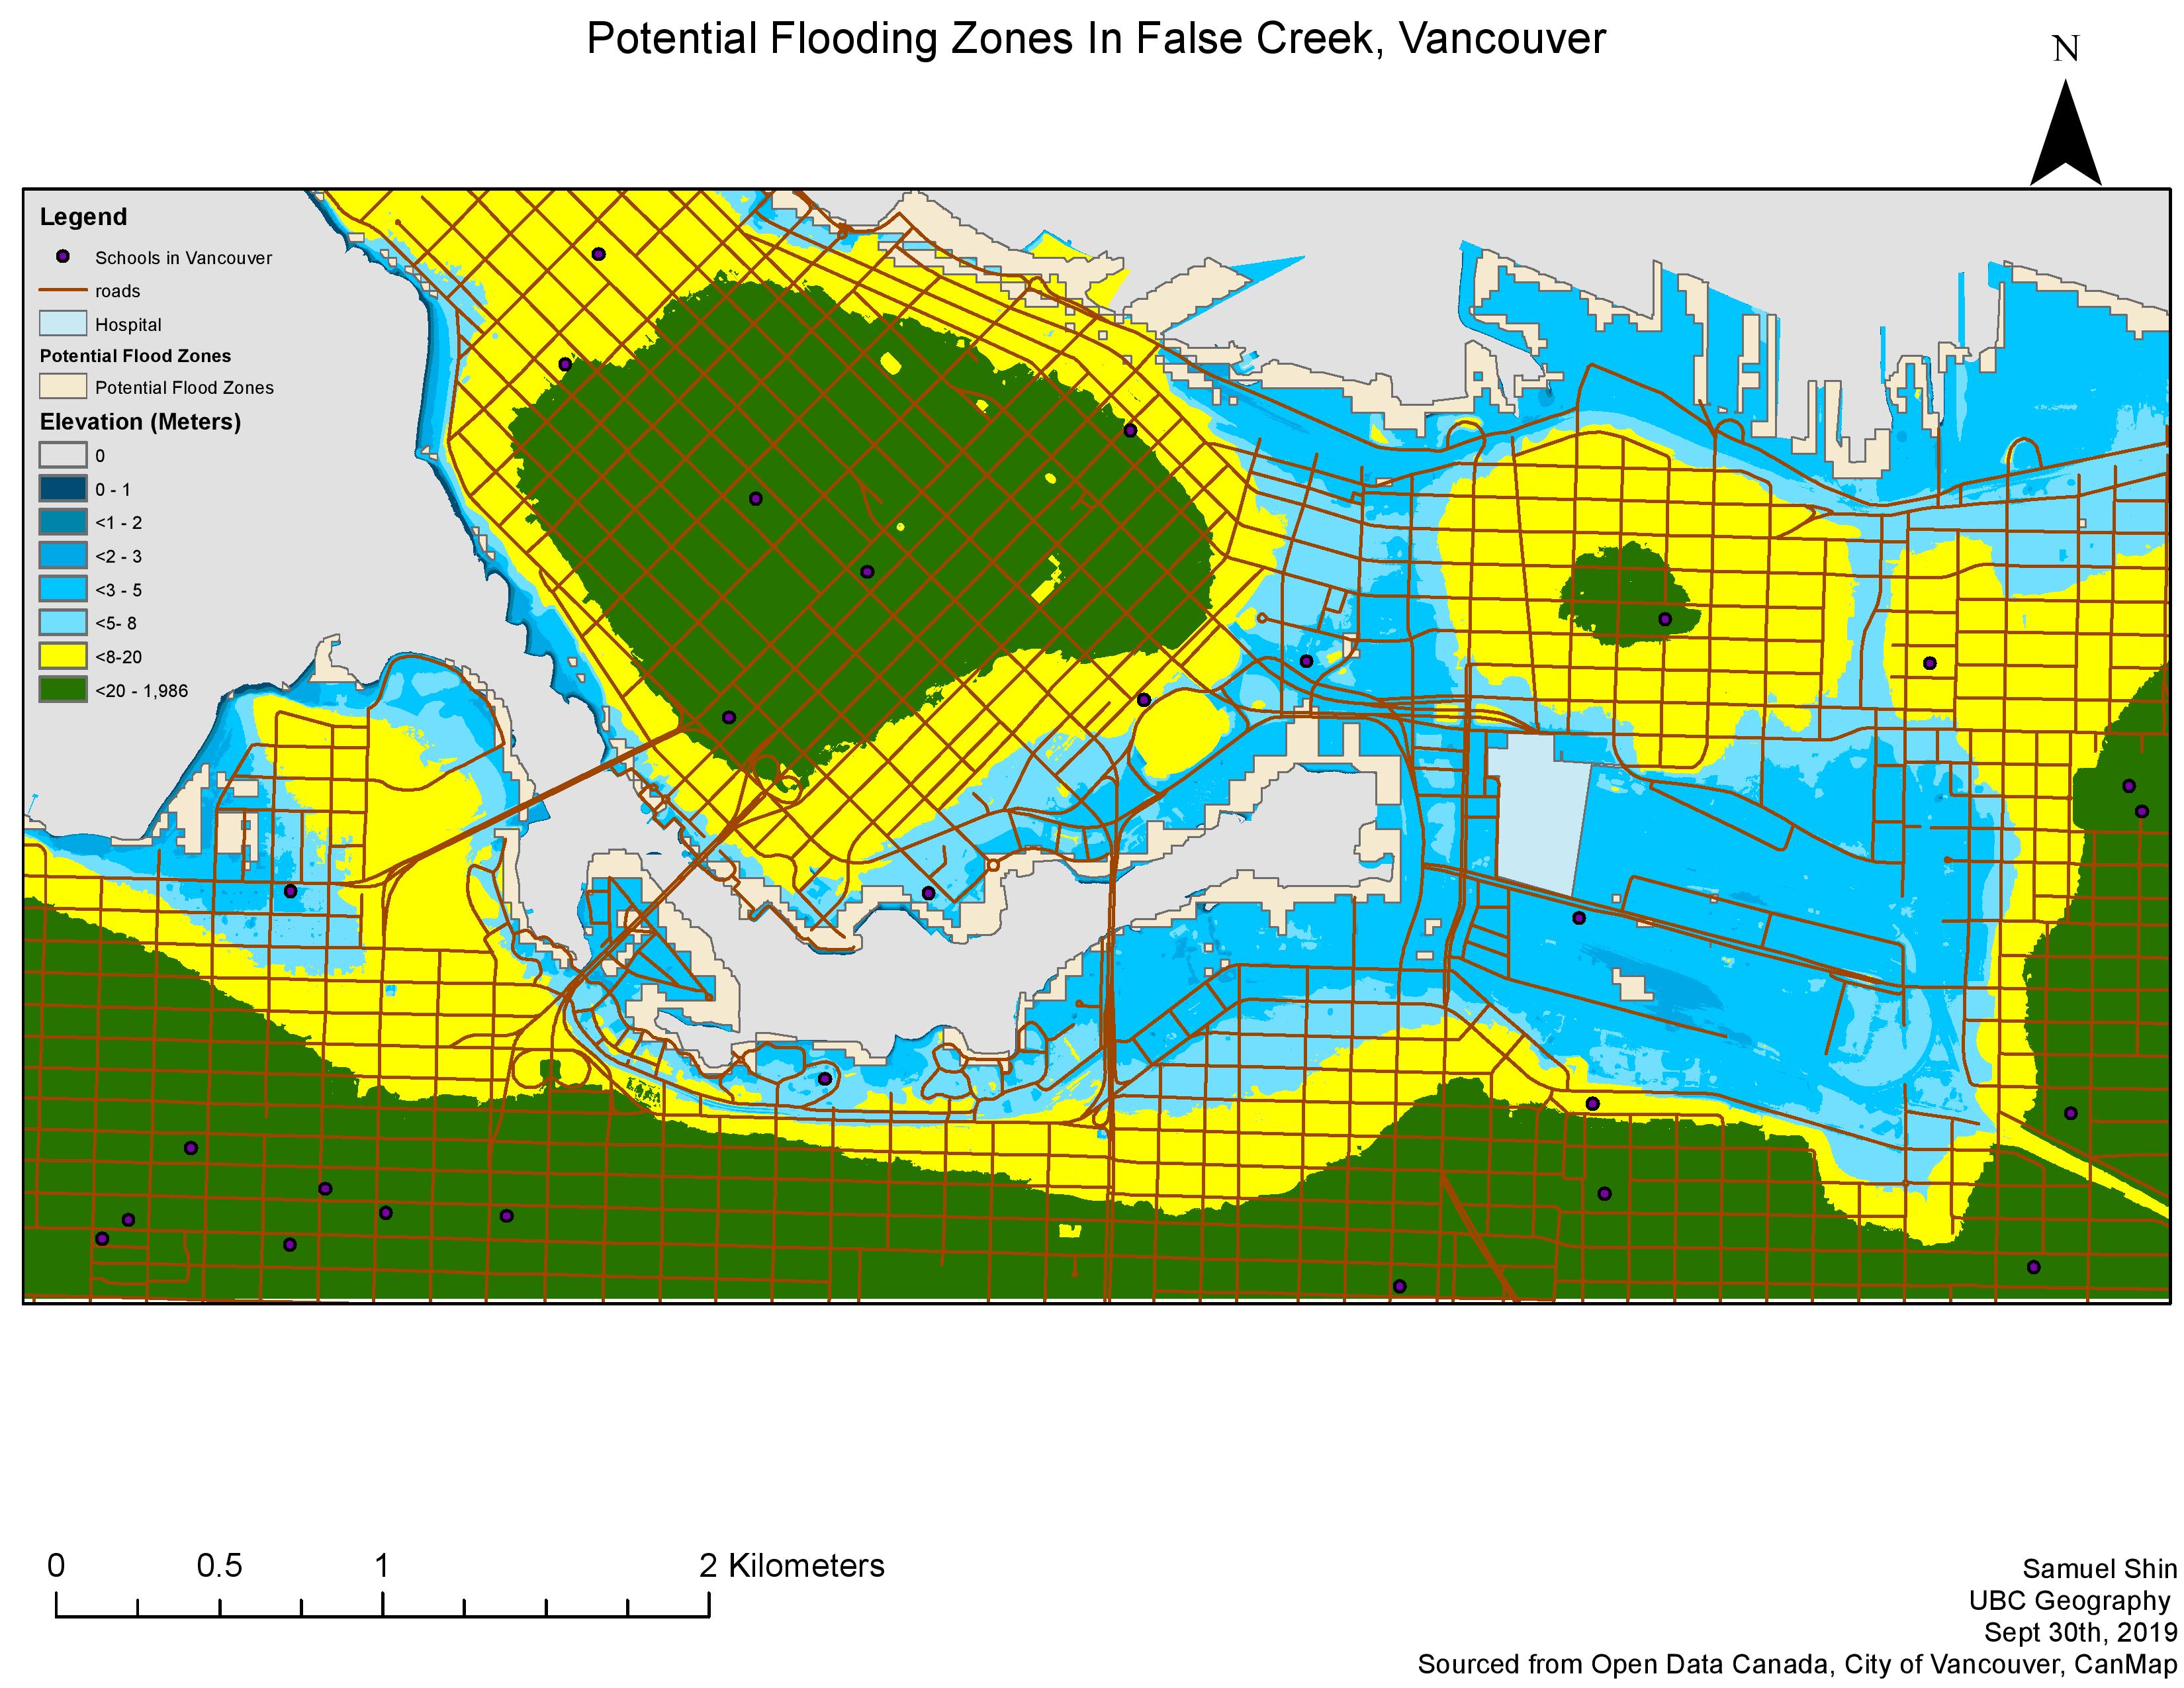
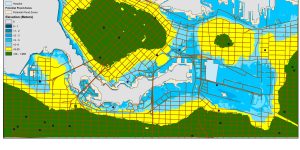
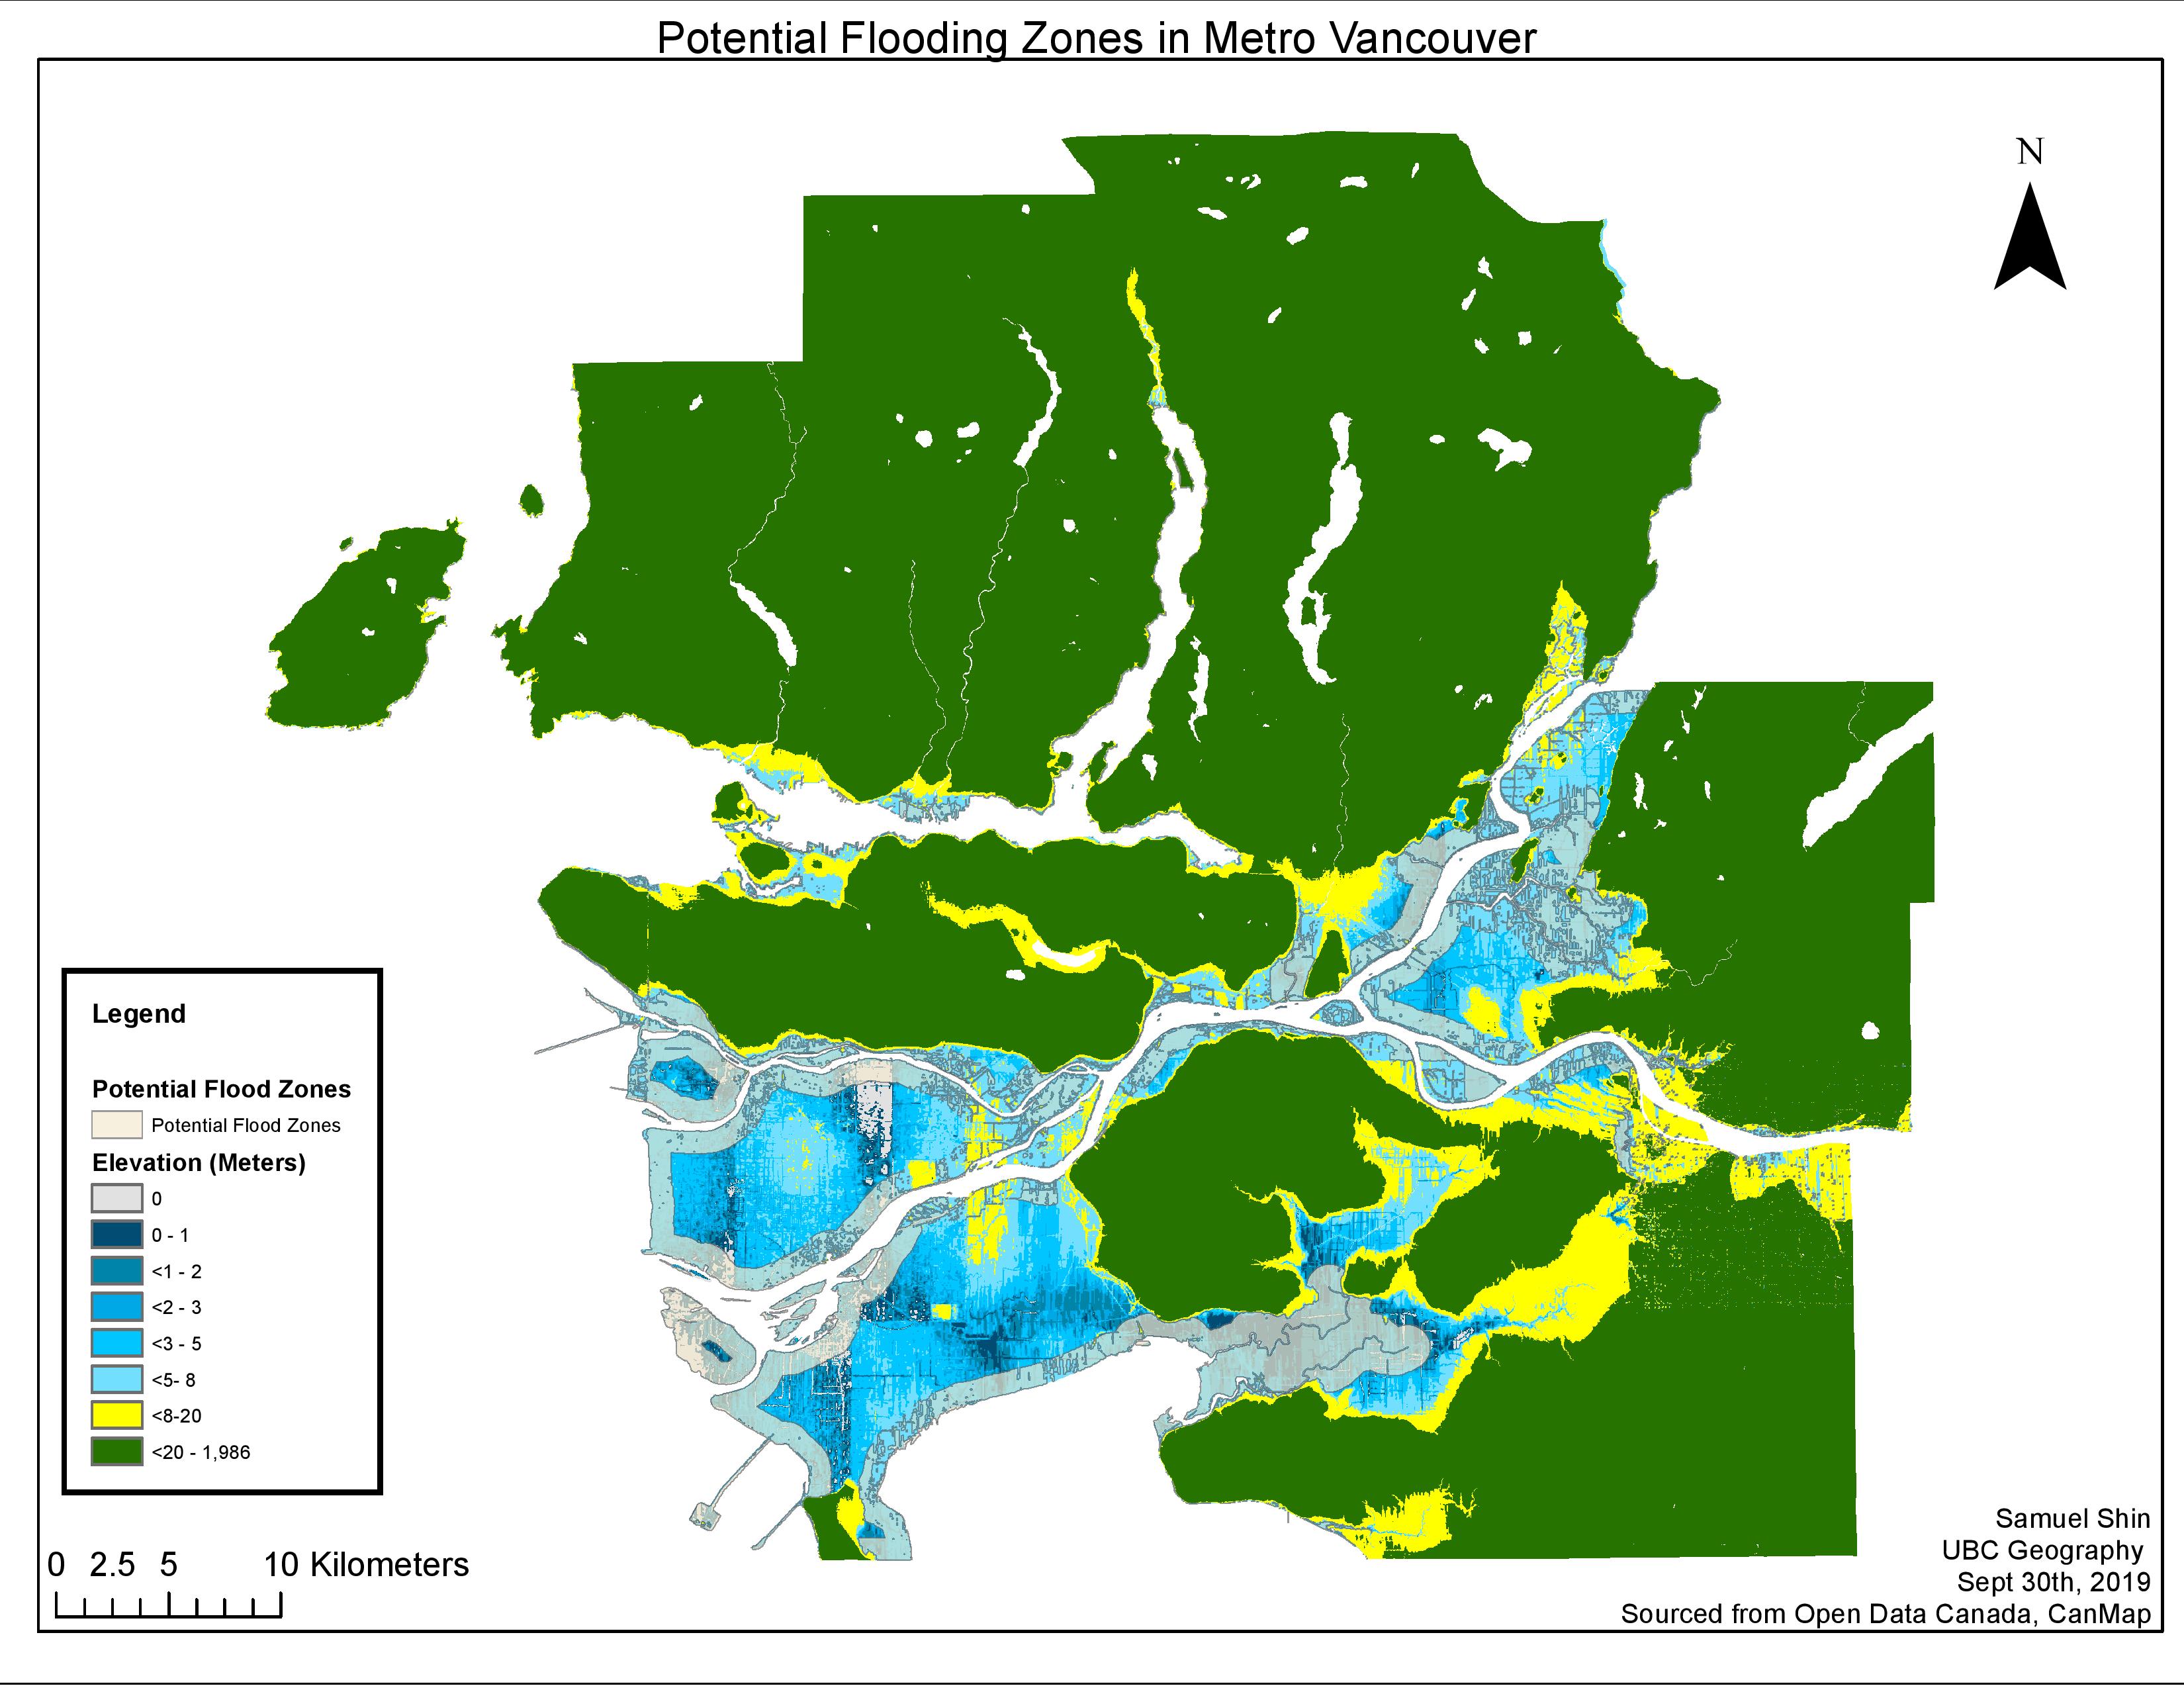
Considering this example of the Storm Surge, we can see with the 4 maps created. It creates an analysis showing flood-plain levels in Metro Vancouver and how it affects certain points and lines on the map such as the roads, schools and the potential building site of St. Paul’s hospital in False Creek area.
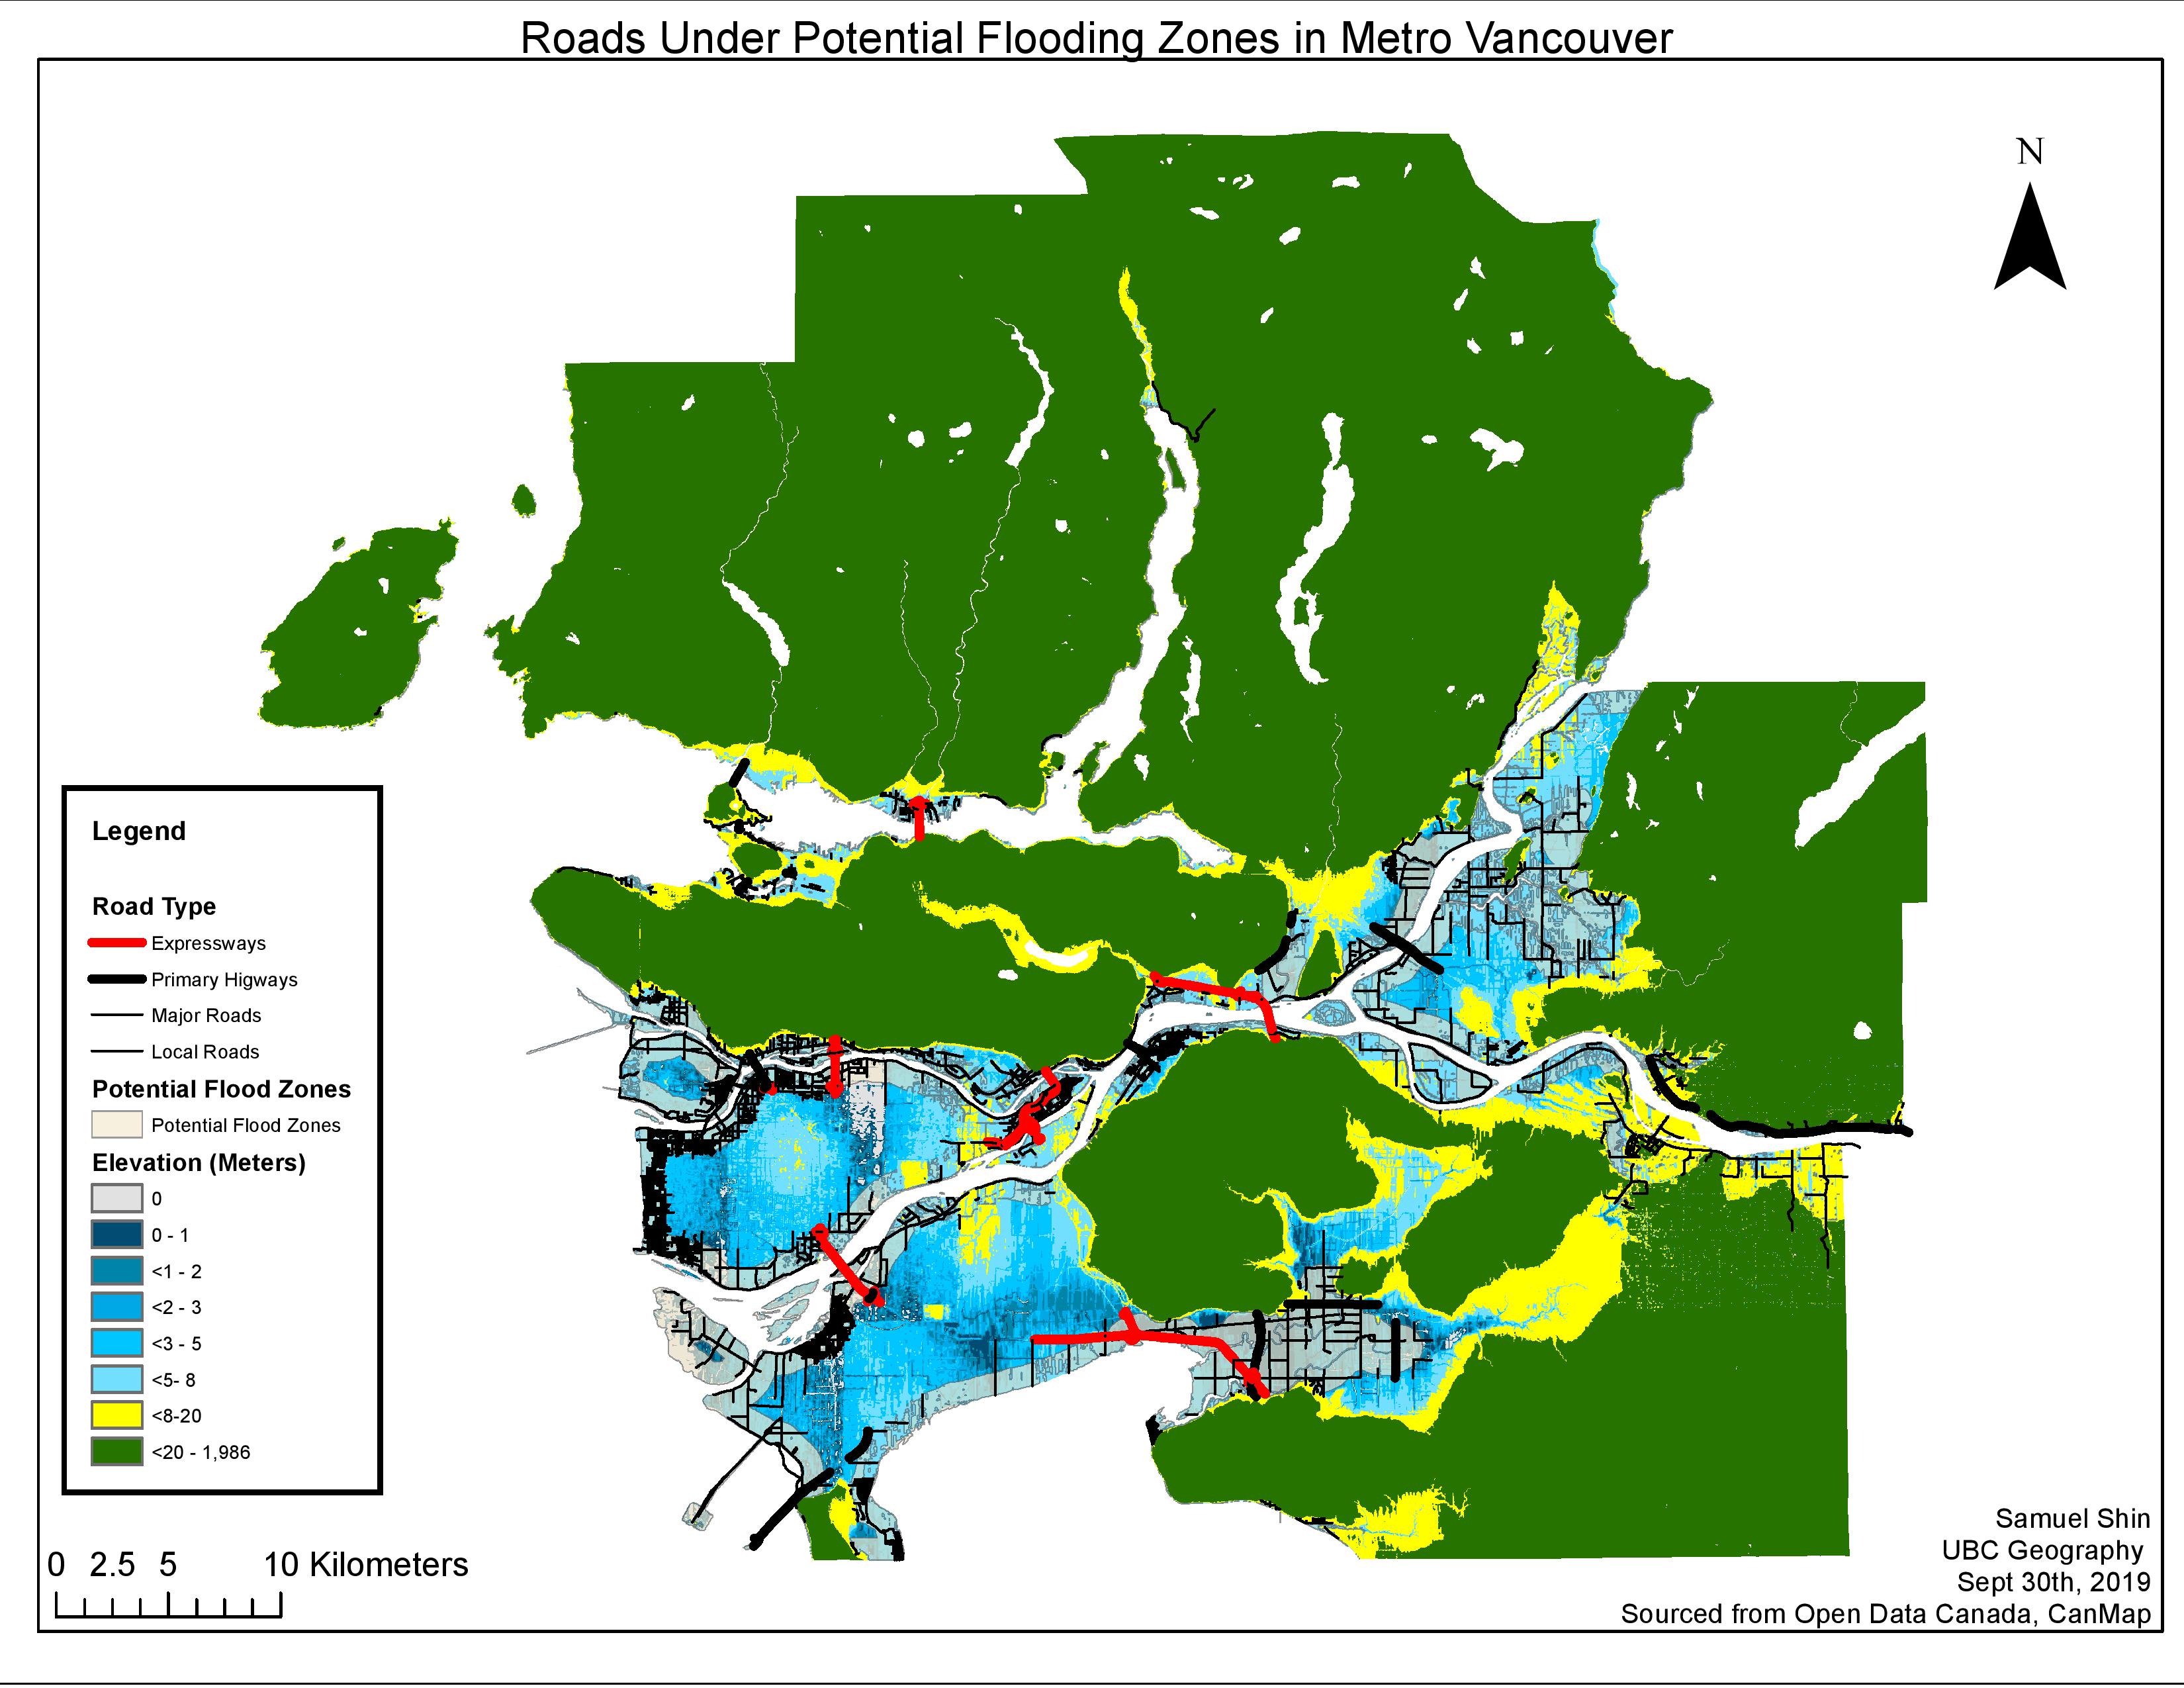
We find that many of the areas in Pitt Meadows, West Vancouver, Richmond and Delta; and some in Southern Surrey and Downtown Vancouver are under the expected flood elevation levels and are in potential susceptible areas of flooding. However, we cans also see that in Downtown Vancouver, there has been consideration for where to build schools, as none of the schools in Vancouver are underneath the flooding zone presented.
Considerations for further research
The DEM data is presented in a raster file, as it presents where each individual pixel is represented by an elevation. However, when we change the data to polygons, we can see the changes in elevations in clearer detail. Data error could be present, as there is no correction to human error. The flood lines may be an understated height, and may go above the estimations. Lastly, the pictures taken come from LANSAT data. Therefore there may be technical errors in the heights projected as well.
Learned how to classify and symbolize DEM files; Reclassified the DEM file of Vancouver by using value to represent elevation
Learned how to use polygon lines to create buffer lines; showed the proximity of the potential storm surge.
Used the data present to visualize potential land for building hospitals in False Creek, Vancouver, as well as existing schools in Metro Vancouver under the potential flooding zone.