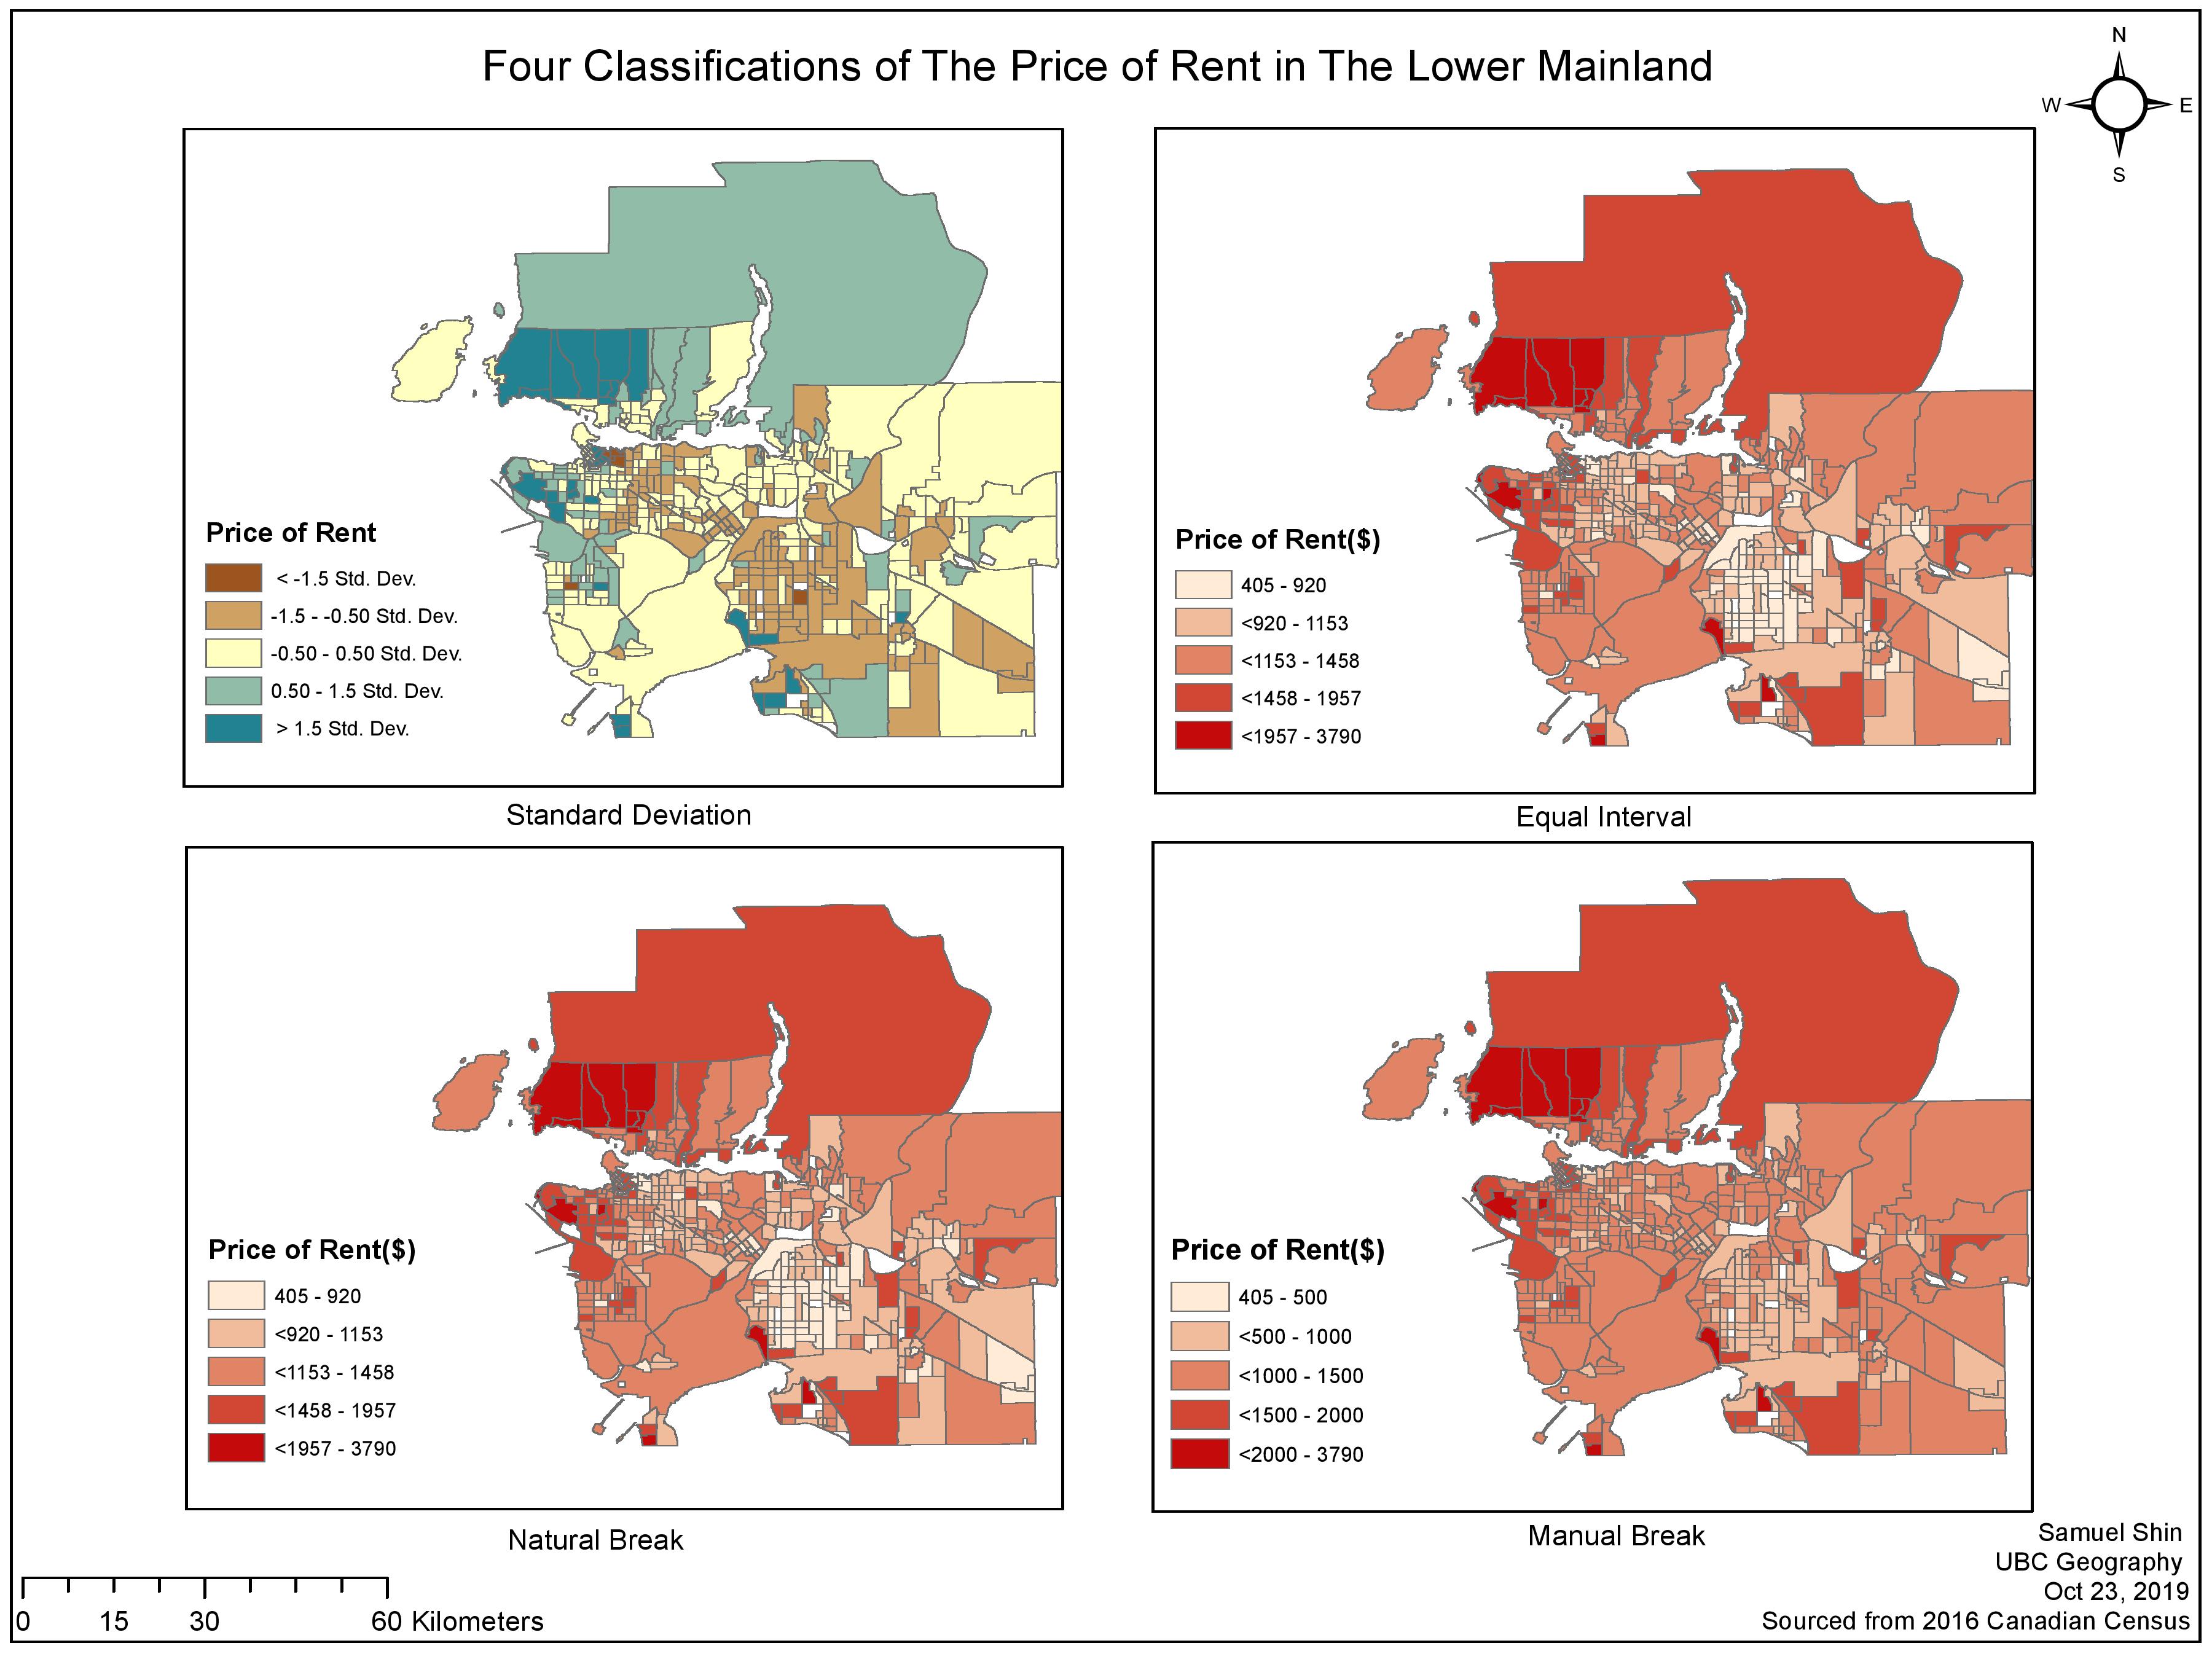
Data Classification
Understanding the four methods of classification presented within this map, I will explain how each maps data was calculated through one of four methods: Natural Break, Equal Interval, Standard Deviation, and Manual Breaks.
Natural Break: this method is the default method used within ArcGIS, and looks for the natural breaks within a dataset. It looks at a histogram, and views where there are large gaps between the data.
Equal interval: This method takes to take the range of the dataset, and calculates the common differences to determine class intervals. Uniform dataset
Standard deviation: Calculated by the mean and the standard deviation of a dataset. Formulaic question Take the number from a normal distribution.
Manual breaks: This method is used when the operator themselves input the breaks manually into the program.
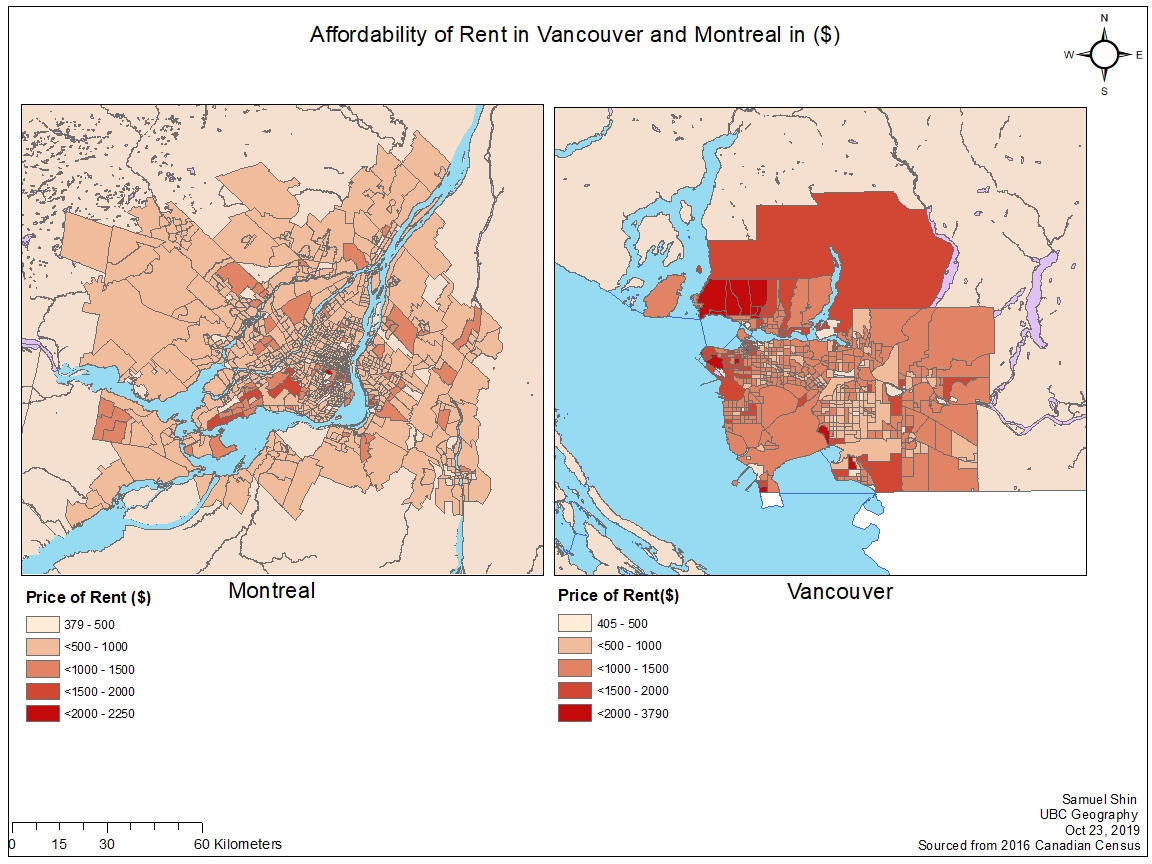
What does this data represent?
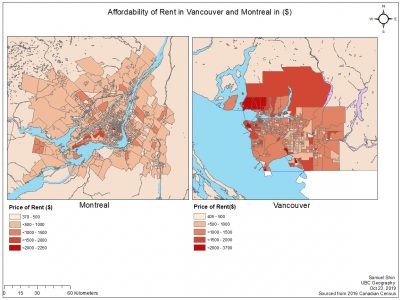
This data was obtained through the 2016 Canadian Census data, the UBC Library, and Chass. The data presenting on this map visualizes the median monthly costs for rented dwellings in Vancouver and Montreal, with each district on the map presented as a census tract. The areas which house no population are visualized in white on each map. These areas on the may have no data due to a lack of occupants within the census tract being able to fill out the census. No rental properties may exist within the areas as well, which may create these skews within the data. Errors and uncertainties which may be presented in this map may be that not all areas within Vancouver and Montreal may be rentable. When census data is used, we assume that this data can represent an accurate view of each tract. However due to lack of participation or information, we may sometimes get skewed data. Population participation is required for us to have un-skewed data.
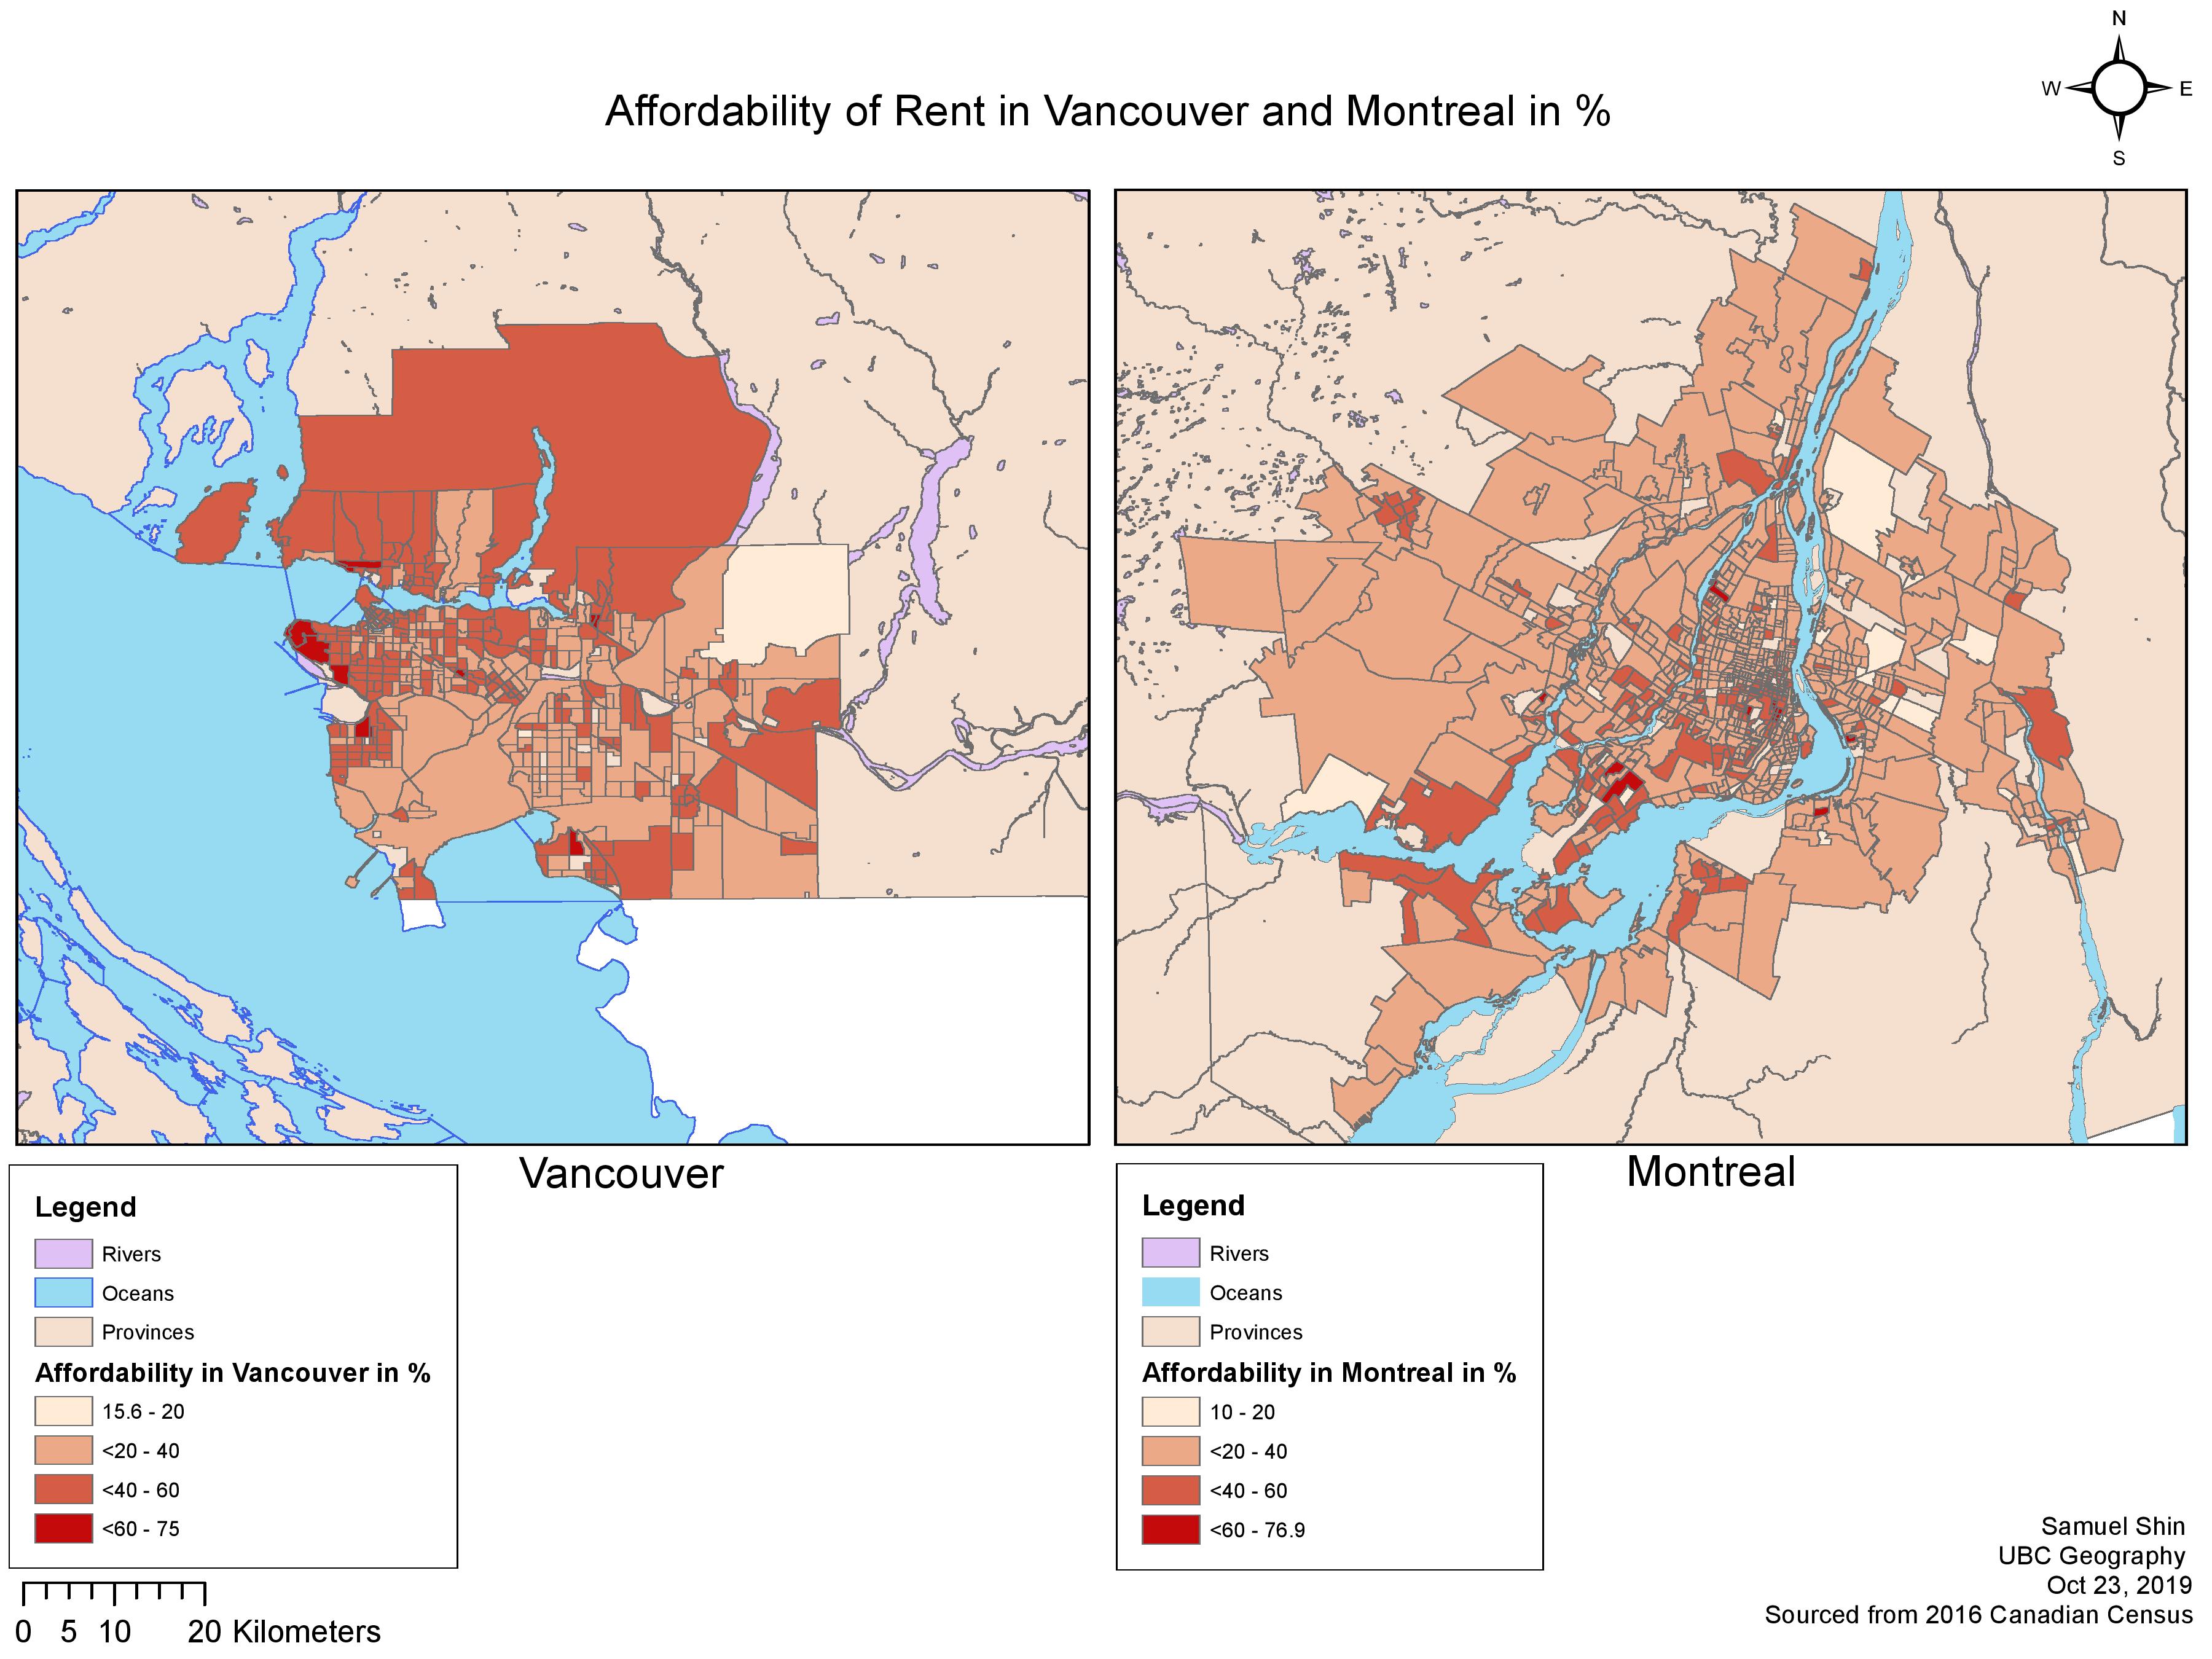
affordability?
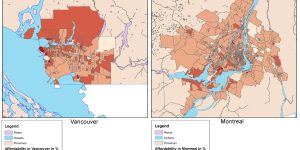
Affordability in this map measures the percentage of households that spend greater than 30% of their income on rent. Darker areas on each maps presents that there are people within the census tract that spend greater than 30% of their income on rent. In my opinion I feel that this is a better indicator of shelter affordability than rental cost alone because it takes into account how much people are making and spending on rent. By taking this to consideration, we can see that affordability could change how people can spend their money. Considering if most of our pay goes into rent, it plays a major part in both our income and our lives. Affordability presented for a city a standard of living, showing in which the income needed to sustain within a city.


Learned how to access Census data, and the difference in Census tracts and Dissemination Areas
Learned how to differentiate between four methods of data classification: Natural Breaks, Equal Interval, Standard Deviation, Manual Breaks
Learned how to create a geodatabase, and its importance to storing data